How Pareto Charts Can Improve Quality of Business Processes
We are all aware of the impact of poor quality processes. How many of us really take this into account during the performance of our routine daily tasks? Do you use a Pareto Chart to analyze your customer complaints, business processes or product defects? Do you know what a Pareto Chart is?
A Pareto Chart is a special form of column graphs that is used to graphically summarize and display the relative importance of the differences between groups of data. Vilfredo Pareto (1848-1923), a renowned economist performed extensive studies about the unequal distribution of wealth and formulated various mathematical models to quantify this distribution. During the late 1940’s, Dr. Joe M. Juran, applied Vilfredo Pareto’s “principle of unequal distribution,” more commonly known as the 80/20 rule, to the phenomenon of the “vital few” and the “trivial many”. The result is a “Pareto Chart.”
Sample Pareto Chart
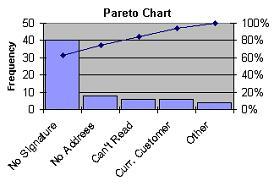
Pareto Charts are very useful tools to focus attention and apply resources to the “big” problem areas in your business. Once your data is collected, you simply sort the numbers in either an ascending or descending sequence. The left-side vertical axis of the Pareto Chart is labelled Frequency (the number of counts for each category), the right-side vertical axis of the Pareto Chart is the cumulative percentage, and the horizontal axis of the Pareto Chart is labelled with the group names of your response variables.
Pareto Charts answer a most frequently asked question, “What are the areas that are causing us the most difficulty in our business?”
Recently, I was talking to a customer who was explaining a situation, which illustrated the importance of using a Pareto Chart. It seems that this company has very many clients and the nature of their business is such that its personnel need to submit expense claims periodically and be reimbursed from a company client. Due to the nature of the business, the personnel submitted their expense accounts to a central office for review where they were subsequently transcribed into a format for the company’s clients. In submitting claims, personnel were provided guidelines. Not all the guidelines were fully understood as different clients have different requirements for expense claims.
Consider the time it takes for the personnel, the centralized administrator and the ultimate customer to process the expense accounts. The documents are all handled three times at a minimum! Furthermore, should there be any discrepancies in any of the two early reviews, the reimbursement payment would be delayed while the discrepancies were addressed and sorted out at the customer’s offices.
What a tremendous opportunity for continuous improvement! A review and improvement of the existing expense claim processing procedure would benefit the company by reducing handling and improving payment efficiency. To improve the expense claim process it was useful to develop a Pareto Chart to reveal the greatest problem areas.
By analyzing the Pareto Chart, it was possible to improve the claims handling process. Standardized guidelines were prepared for expense claim submissions that would meet all customer requirements. Monitoring the process is necessary to ensure continued effectiveness. As additional changes are required, proactive action can easily be introduced.
Over time, the nature of the “vital few” problems will change and the individual processes within the organization streamlined. The goal of using this technique is to ensure that more can be done with less.
In conclusion, using Pareto Charts help you identify:
- What are the largest issues facing your team or business?
- What 20% of sources are causing 80% of the problems (80/20 Rule)?
- Where should you focus your efforts to achieve the greatest improvements?